Camping & Outdoors
![]() – Precipitation (avg. mm)
– Precipitation (avg. mm)
![]() – Temperature (avg. degrees °C)
– Temperature (avg. degrees °C)
![]() – Density of holiday parks
– Density of holiday parks
![]() – Holiday park prices (avg. per day)
– Holiday park prices (avg. per day)
Nature & Landmarks
![]() – Big Things (per 100 km²)
– Big Things (per 100 km²)
![]() – Terrestrial protected areas (% share)
– Terrestrial protected areas (% share)
![]() – National parks (% share of land area)
– National parks (% share of land area)
![]() – Scenic routes (% length of all scenic routes in AU)
– Scenic routes (% length of all scenic routes in AU)
Infrastructure & Accessibility
![]() – Speed limits (km/h)
– Speed limits (km/h)
![]() – Car accidents (per 100,000 inhabitants)
– Car accidents (per 100,000 inhabitants)
![]() – Quality of roads (Length of unpaved roads per 100 km²)
– Quality of roads (Length of unpaved roads per 100 km²)
![]() – Length of roads (per 100 km²)
– Length of roads (per 100 km²)
![]() – Public toilets (per 100 km²)
– Public toilets (per 100 km²)
![]() – Radio coverage (per 100 km²)
– Radio coverage (per 100 km²)
![]() – Mobile coverage (scale 1-50)
– Mobile coverage (scale 1-50)
![]() – Service stations/petrol stations (per 100 km²)
– Service stations/petrol stations (per 100 km²)
![]() – Car hire ratings (scale 1-100)
– Car hire ratings (scale 1-100)
Affordability
![]() – Road tolls (categories 1-3)
– Road tolls (categories 1-3)
![]() – Hotels (avg. price/night)
– Hotels (avg. price/night)
![]() – Parking (1h, on street)
– Parking (1h, on street)
![]() – Hotels with free parking (% share)
– Hotels with free parking (% share)
![]() – Restaurant (avg. price/McMeal)
– Restaurant (avg. price/McMeal)
![]() – Coffee break (avg. price/cappuccino)
– Coffee break (avg. price/cappuccino)
![]() – Car hire (avg. per day)
– Car hire (avg. per day)
Traffic & Sustainability
![]() – EV charging stations (per 100,000 km²)
– EV charging stations (per 100,000 km²)
![]() – Air pollution (avg. annual exposure)
– Air pollution (avg. annual exposure)
![]() – Road congestion
– Road congestion
![]() – Passenger cars (per 1,000 inhabitants)
– Passenger cars (per 1,000 inhabitants)
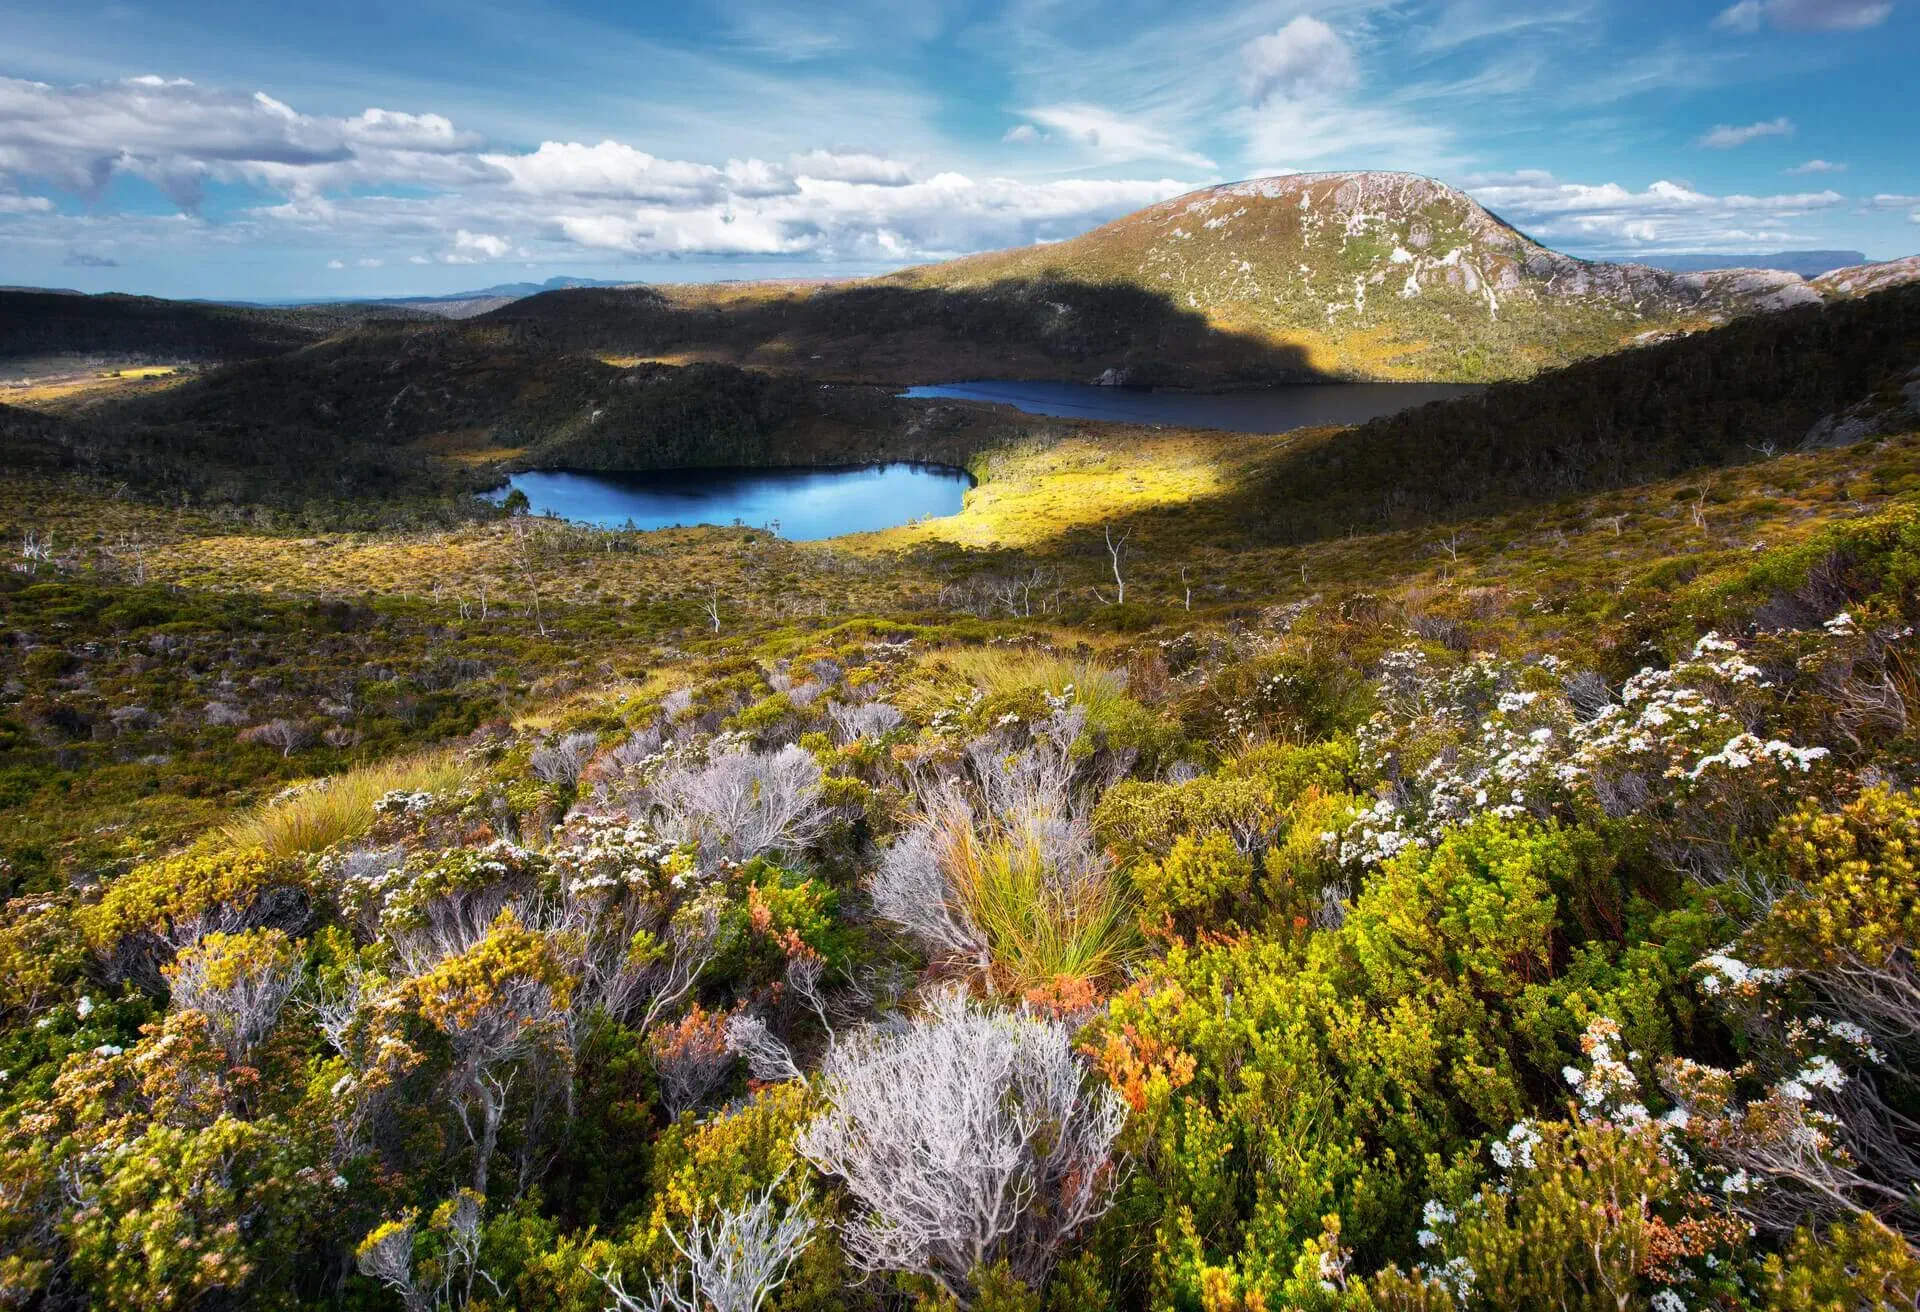
#1 Tasmania
Tasmania rose to the top of the index for many important reasons. As a prime road trip destination, it has few serious car accidents, good radio coverage throughout the state, and has the second-most electric vehicle charging stations for those going on an eco-friendly road trip. Offering great affordability, Tasmania has the highest percentage of hotels that offer free parking and has affordable restaurant prices. There’s also plenty of natural wonder to discover, Tasmania has the most terrestrial protected areas and national parks, plus the least air pollution.
#2 Victoria
Victoria came in a very respectable second place in our rankings. It has great road infrastructure and many useful facilities and services – with the most roads, the most public restrooms by far, the best mobile data coverage, and the most electric vehicle charging stations and service stations. All of this makes it a breeze to get around in the state. It also has the second-best hotel prices. As far as nature and attractions, it’s the state with the most Big Things to see and has a good number of national parks as well.
#3 Northern Territory
The Northern Territory came in the No. 3 spot for best road trip state. It scored well in many pricing factors as well: for example, you won’t need to pay any road tolls, and it has the cheapest parking and holiday park prices. The Northern Territory also happens to have the least traffic congestion in its cities, the second-best air quality and the second-most scenic routes to enjoy.
Affordability
#1 Tasmania
Tasmania ranked the most affordable state to take a road trip in. This is because it scored well on several factors: it has no road tolls to pay, has the second-lowest hotels prices of all the states and terriroties, has the cheapest parking prices (tied with the Northern Territory), and has the highest percentage of hotels with free parking.
Camping and Outdoors
#1 Tasmania
Tasmania won in this category primarily because it has the highest amount of terrestrial protected areas to camp in and enjoy the outdoors. It also has the most national parks by far – almost twice as many as second-place Victoria. The fact that Tasmania has mild temperatures in summer with not too much rain makes the island an ideal area for sleeping outdoors while on a road trip.
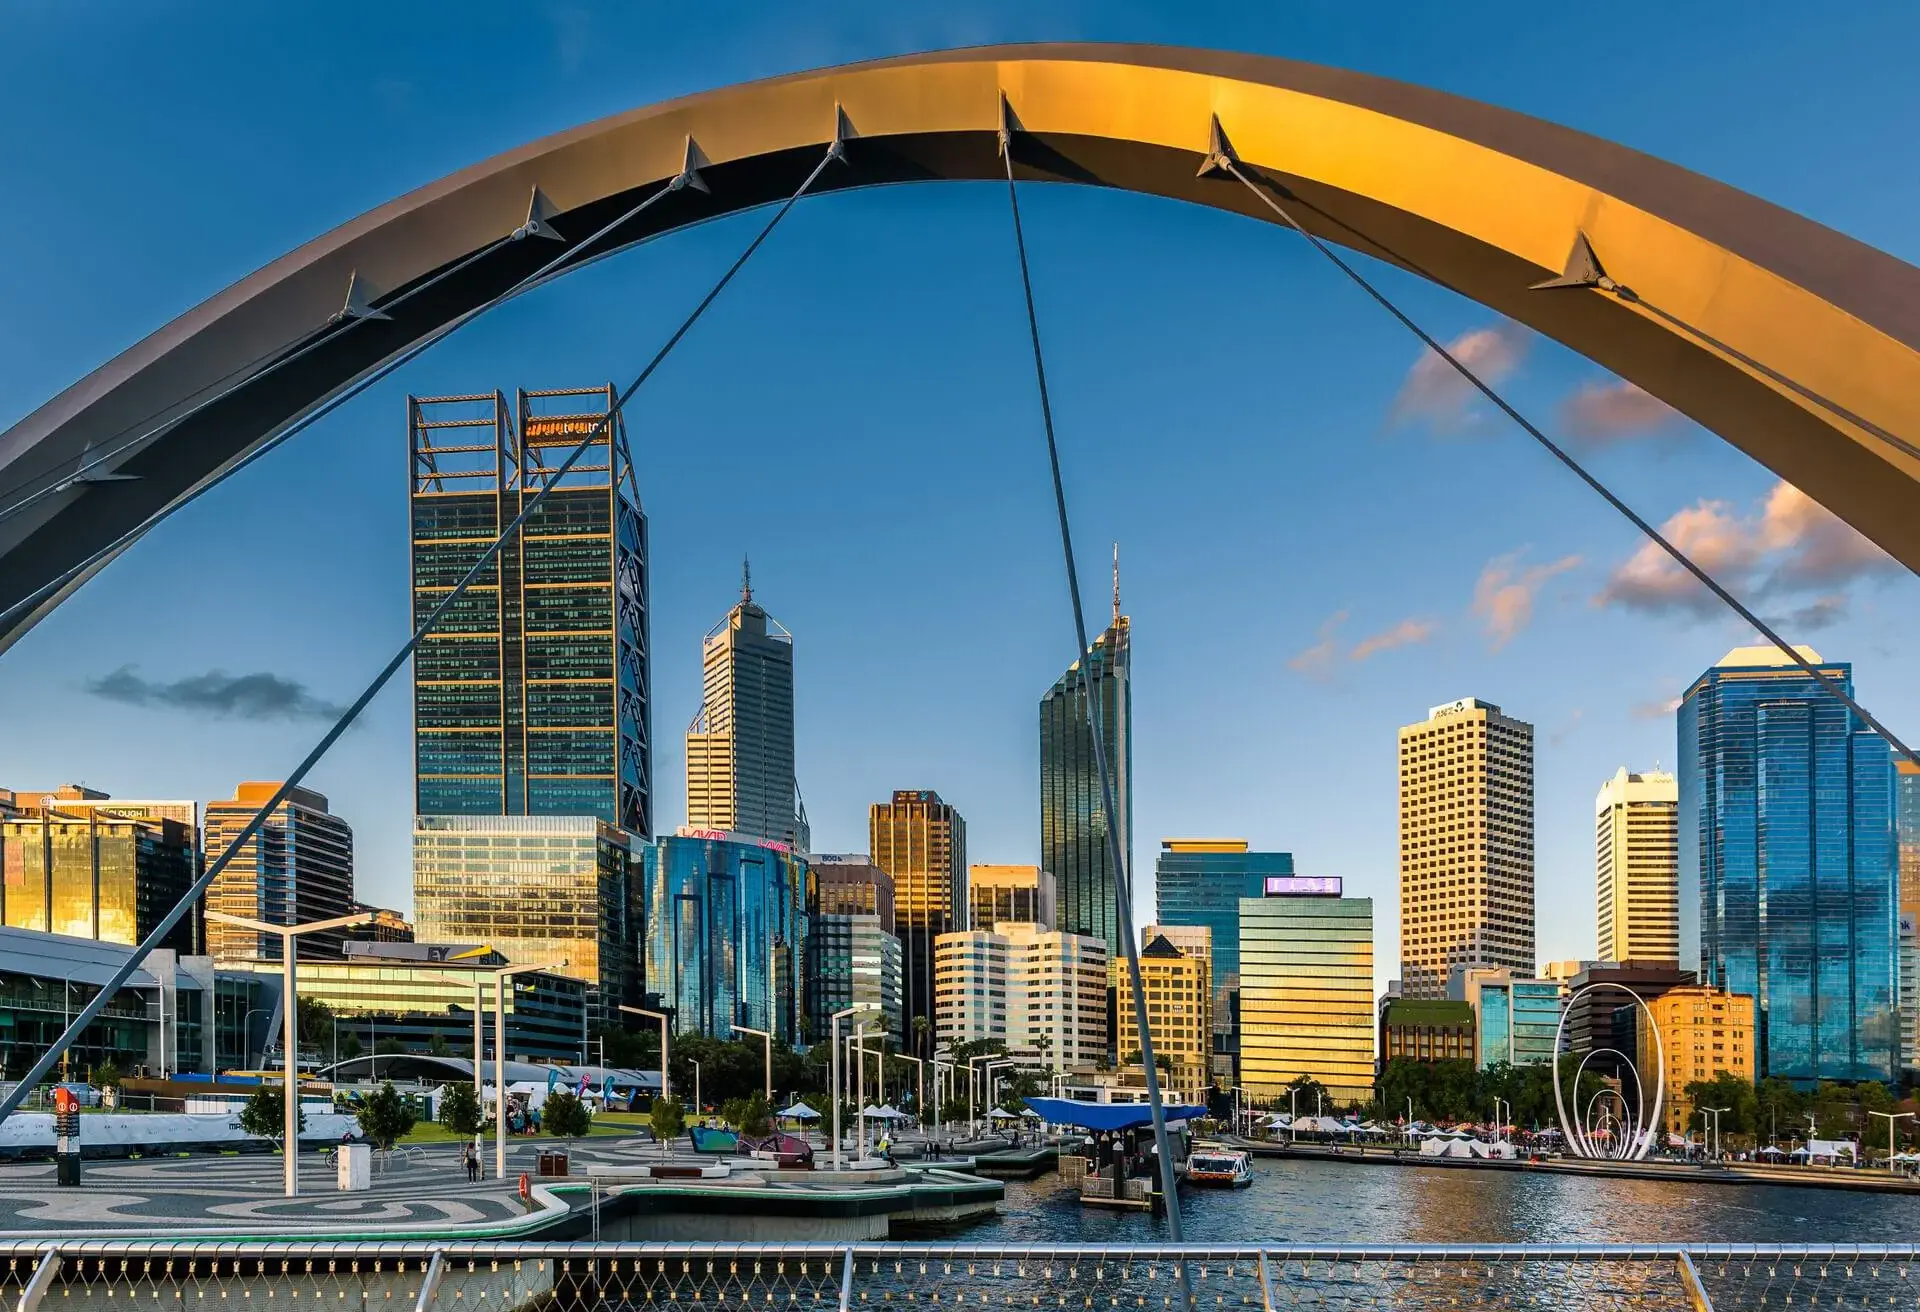
Visit Western Australia